![]()
Measuring Tools
The measuring tools to the right have something in common can you tell what it is? (Hint: look at the shape...). Answer here...
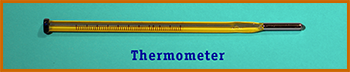
- At the top, is a thermometer, "thermo" means "heat", "meter" means "measure" (both Greek words). If it gets hotter, what will happen to the blue liquid inside? How will it move? Can you explain why?

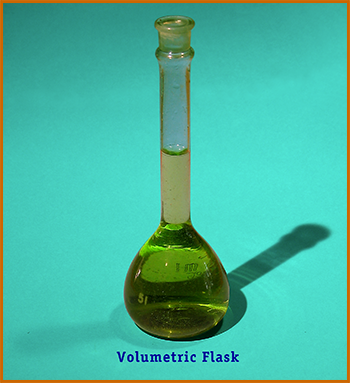
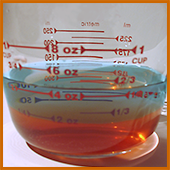
- In the middle is a volumetric flask—note the etched ring on the neck, between the two white lines drawn in. When filled exactly to that ring, the flask contains an exact volume of liquid (2000 ml = 2 liters for the flask shown).
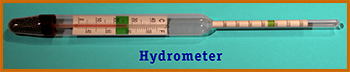
- On the bottom is a hydrometer ("hydro" = water in Greek)—it measures something about water, namely density and buoyancy, which can indirectly tell how much salt is dissolved. Just how that works is coming up next...
![]()
Bulge!
All three measuring devices have most of their volume in a big bulge at the bottom, and get really skinny at the measuring mark(s). All three use changes in volume to determine the result of the measurement, and the narrowing makes a small change more noticeable:
- Heating (cooling) makes the liquid in the thermometer bulb expand (contract), increasing (decreasing) the volume it occupies; by forcing that change of volume to happen in the skinny stem, a longer distance along the stem is needed to contain the change in volume, thus making it easier to measure.
- Adding more liquid to the flask raises the level, but not so noticeably where the flask is wide; having the last bit go into the skinny neck makes the rise more noticeable, making accurate measuring easier.
- The hydrometer floats in liquid (e.g. fresh or salt water), and depending on the density, it will float at different levels; by having the change in immersion occur along the skinny neck, a small change in displacement volume requires a large change in immersion of the stem, again making it easier to measure accurately.
Back...
Why does heating make a liquid expand?
Why does salt in water increase its buoyancy?
![]()
![]()
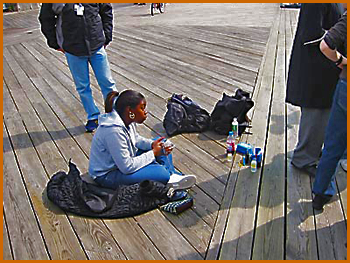
Estuary = Salty + Fresh
Are the waters around New York City salty or fresh? (Answer—a mixture! called an "estuary"). We are about to investigate some of the properties of this mixing of waters.
Materials
- Notebooks & pencils!
- Water
- NaCl
- Potatoes (1 piece per group)
- Cups (clear plastic), 2 per group
- (If available) graduated cylinders
- Food coloring
Activities
- Each group gets 2 cups, each half-filled with water (preferably of exact measured amount), NaCl to put into one cup, and a potato to put into the other.
- Put potato in one cup—write down observations.
- Put salt in the OTHER cup, and work on dissolving it completely (alternatively, provide saturated NaCl solution, prepared in front of class).
- (Possibly) have some or all groups put food coloring in their salt or fresh water.
- Students in group take turns adding small amounts of salt water to potato glass, until it "levitates".
- Record how much salt water was added to achieve this.
Wrapup
A new way of telling salt from fresh water has been discovered! We see that salty water sinks below fresh water, and that it is better at floating things.
Discuss why this is important in local waters.
![]()
![]()
A Neat Explanation
We got 3 good questions from our model estuary observations:
- Why are the NaCl crystals shaped like cubes?
- How did the salt disappear when water
was added? - Why does the salty water go to the bottom?
![]()
A "good explanation" for these observations should be:
- simple and easy to understand
- predictive of other phenomena yet to be observed
- testable by further experiments
Essence of the Scientific Method!
The explanation we'll examine is based on the atomic theory of matter and the kinetic theory of heat, fancy names for a simple set of ideas:
- All matter is made of tiny spheres of about 100 different kinds, called "atoms".
- Atoms can stick to each other according to specific rules, forming "molecules".
- Atoms and molecules are constantly moving and jiggling ("kinetic" means "moving" as in "cinema"="moving pictures").
- This kinetic jiggling is a form of energy, called "heat"—faster = hotter.
It's amazing how many different phenomena can be explained by these simple ideas—including our estuary observations:
- NaCl crystal shape
- vanishing of NaCl into solution
- stratification of fresh and salt water
![]()
![]()
Science Pictures
Here's a sampling of basic science pictures captured with a simple low-end digital camera. Some were obtained by holding the camera up to the eyepiece of a 40x dissecting microscope or similar instrument.
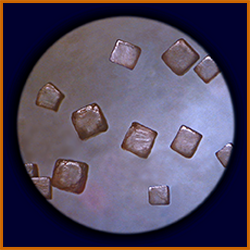
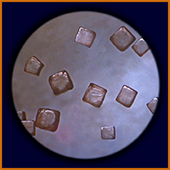
salt crystals (NaCl)Table salt
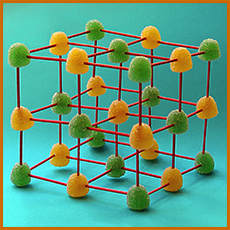
This molecular model of an NaCl crystal, was made
by students, using gumdrops and toothpicks. Colored marshmallows or styrofoam spheres can be used instead—and for other molecular modelling, as well.
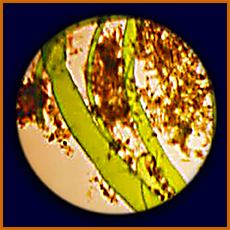
microscopic view of alga/seaweed
scraped from Pioneer
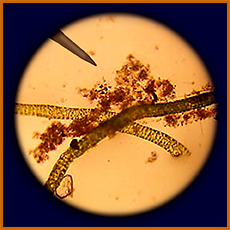
another microscopic view of alga/seaweed
scraped from Pioneer
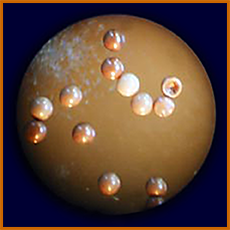
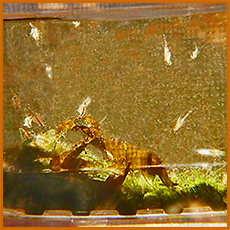
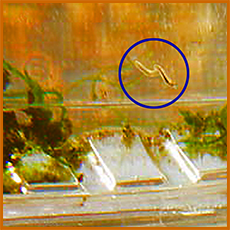
Artemia (brine shrimp, "sea monkey")
eggs, can be hatched in class
early larval stage of Artemia
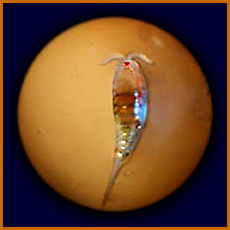
more advanced stage ("nauplius") of
Artemia, showing larval red eye
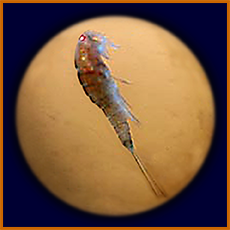
same, seen sideways
adult male
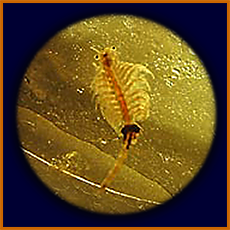
adult female
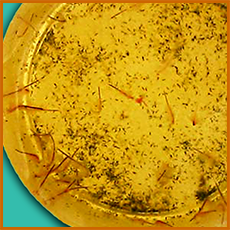
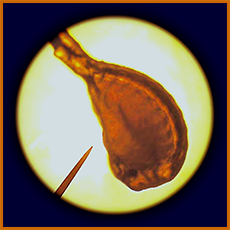
Here is a cupful of adult artemia, seen from above,
with chlorophyll "poops" from digested phytoplankton.
salad-bar aquarium.
Some points are:
- sunlight powers ecosystems
- atoms are reused—regenerated oxygen keeps animals from suffocating
- recycle salad containers into interesting and useful objects
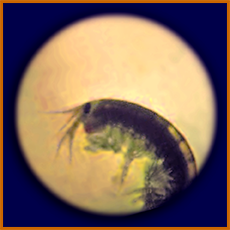
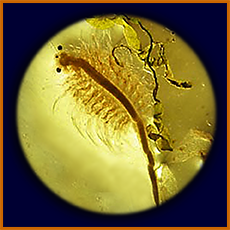
An amphipod (relative of shrimp) from
a fouling community from Pioneer's hull
(as seen under a microscope).

NOTE: Recycle clear plastic
containers
for your aquariums!
![]()
![]()
Webify!
The World Wide Web was invented by scientists (particle physicists at CERN in Switzerland) to help share scientific information and ideas. It's even better for that today, and with a digital camera and some basic editing on a computer, it's easy to make Web pages describing and sharing the results of your classroom activities.
![]()
![]()
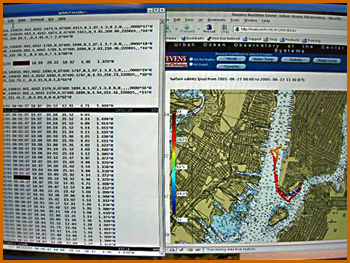
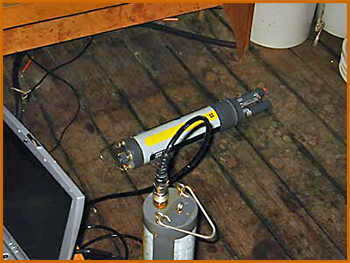
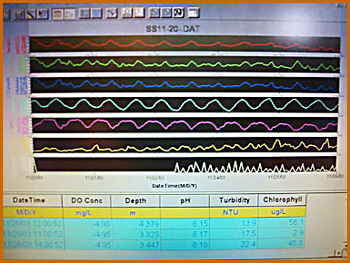
Pioneer Real-time Water Data on the Web
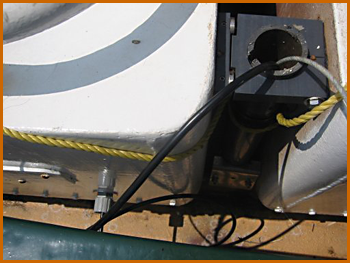
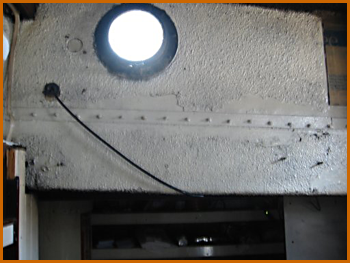
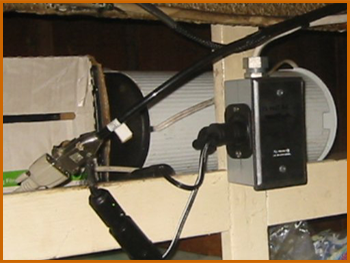
In late Spring 2005, Pioneer was fitted with data-taking and communications equipment, enabling real-time transmission to the Web of position, time, surface water temperature, salinity, and dissolved oxygen level, as measured just below the surface, in the forward area of the centerboard well. Water parameters were measured and transmitted every 20 seconds, position and timestamp were transmitted every 10 seconds. This page describes the installation, configuration, and instrumentation, with links to more technical information, as well as ideas for use in educational programs.
The installation is a joint project among South Street Seaport Museum (providing the vessel and equipment maintenance), Stevens Institute of Technology (providing the communications equipment and Web pages and software presenting the data), and NYC DEP (providing the sonde).
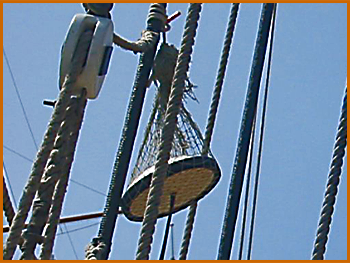
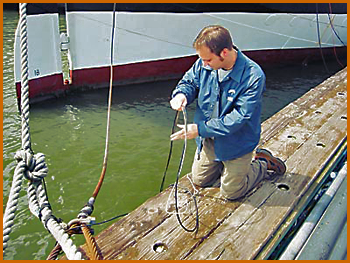
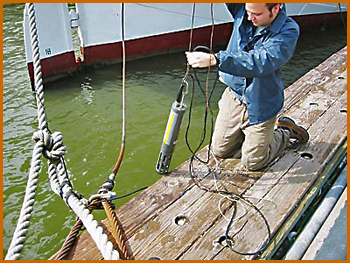
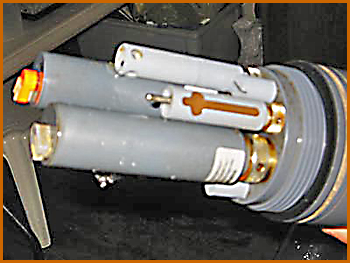
The sonde, a YSI 600XL, is shown here dangling above the open end of a 2" PVC pipe, into which it just fits. In turn, the pipe (about 8' long), just fits into Pioneer's centerboard well, forward of the centerboard. The board has circular curvature around its pivot point near the lower forward corner, so the PVC pipe doesn't get in the way of the centerboard no matter how far it's raised or lowered—clearance less than .5", a small miracle!
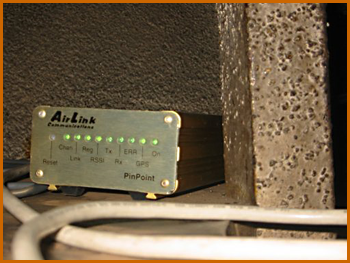
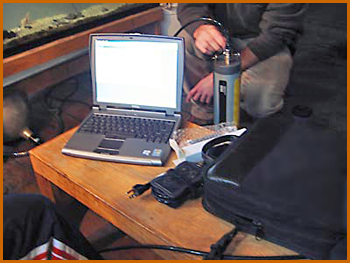
The data transmitted from Pioneer is received by computers at Stevens Institute, where it is stored in databases, and also rendered in real time into Web pages like this, which show the Pioneer's path, with different colors showing the values of a user-selected water measurement parameter (here, salinity). The path shown is that taken on 6/22/2005, for a press conference sail to officially inaugerate the data-taking program. The Web site is at Stevens Institute's Web site; the visitor can select a data and time range to view. At present (December 2005) the modem is back at Stevens, so that's the location shown till Pioneer's refitting next Spring.
In the fall of 2005, DEP's Harbor survey vessel Osprey was also fitted with a cell modem, and this same Web page can be used to show Osprey's data and paths.
![]()
![]()
![]()
![]()
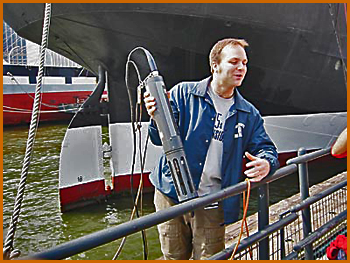
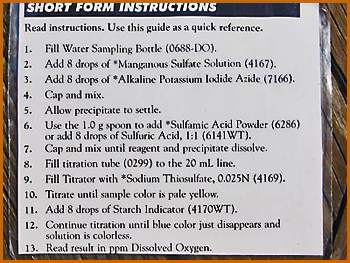
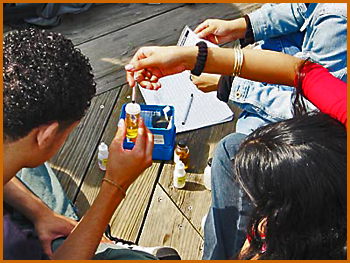
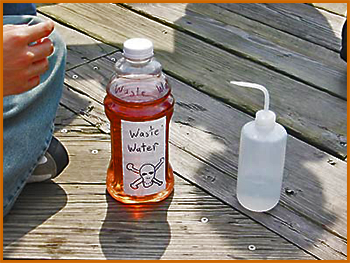
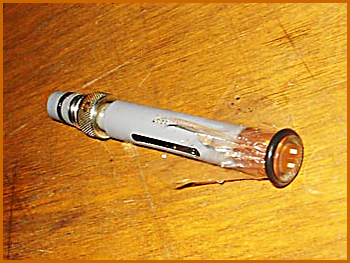
DEP Water Measurements at the Seaport Museum
The NYC DEP (Department of Environmental Protection) has installed at the South Street Seaport Museum an electronic measuring device (called a "sonde") that can measure and record various data about the water it's in. The Seaport sonde is on Pier 16; here DEP scientist Markus Koelbl takes it out of the water for maintenance, and to show a visiting class. The long black cable leads to a computer in the wetlab aboard Peking (whose rudder is in the background).
![]()